← Back to Domains
Fertility

Demographics & Fertility

TFR
1.41 (lowest since 1938)
Replacement
2.08 needed
Childcare Cost
25-35% of income
25%Current
Potential: 55%

✗Key Problems

  • 1.1.41 TFR - lowest since 1938, population decline trajectory
  • 2.First-time buyer age 34 - can't afford house or kids
  • 3.Childcare 25-35% income - highest in developed world
  • 4.Hungary reversed to 1.59 with pro-family policy package

✓Solutions

  • 1.£5,000/CHILD tax credit: Direct support (Hungary/Poland model)
  • 2.HOUSING PRIORITY for families: 3+ bed fast-tracked (Singapore model)
  • 3.FAMILY TAX RELIEF: Reduced rates for parents of 3+ (France model)
  • 4.CHILDCARE EXPANSION: Universal access to age 3 (Nordic model)

Analysis

Root Causes

1

1.41 TFR - lowest since 1938, population decline trajectory

2

First-time buyer age 34 - can't afford house or kids

3

Childcare 25-35% income - highest in developed world

4

Hungary reversed to 1.59 with pro-family policy package

Reform Pathway

1

£5,000/CHILD tax credit: Direct support (Hungary/Poland model)

2

HOUSING PRIORITY for families: 3+ bed fast-tracked (Singapore model)

3

FAMILY TAX RELIEF: Reduced rates for parents of 3+ (France model)

4

CHILDCARE EXPANSION: Universal access to age 3 (Nordic model)

Cascade Effects

Reforms in Demographics & Fertility will have downstream effects on 4 connected domains:

Policy Costings

Rigorous fiscal analysis of Demographics & Fertility reforms
View All Costings →
Fertility

Childcare Fertility Expansion

Upfront
+£1.5bn
Annual
+£8.0bn
Revenue
+£3.5bn
Net Annual Effect
+£11.5bn/year
Payback in 4 years
GDP +0.6%Productivity +0.1%very high uncertainty
3 sources
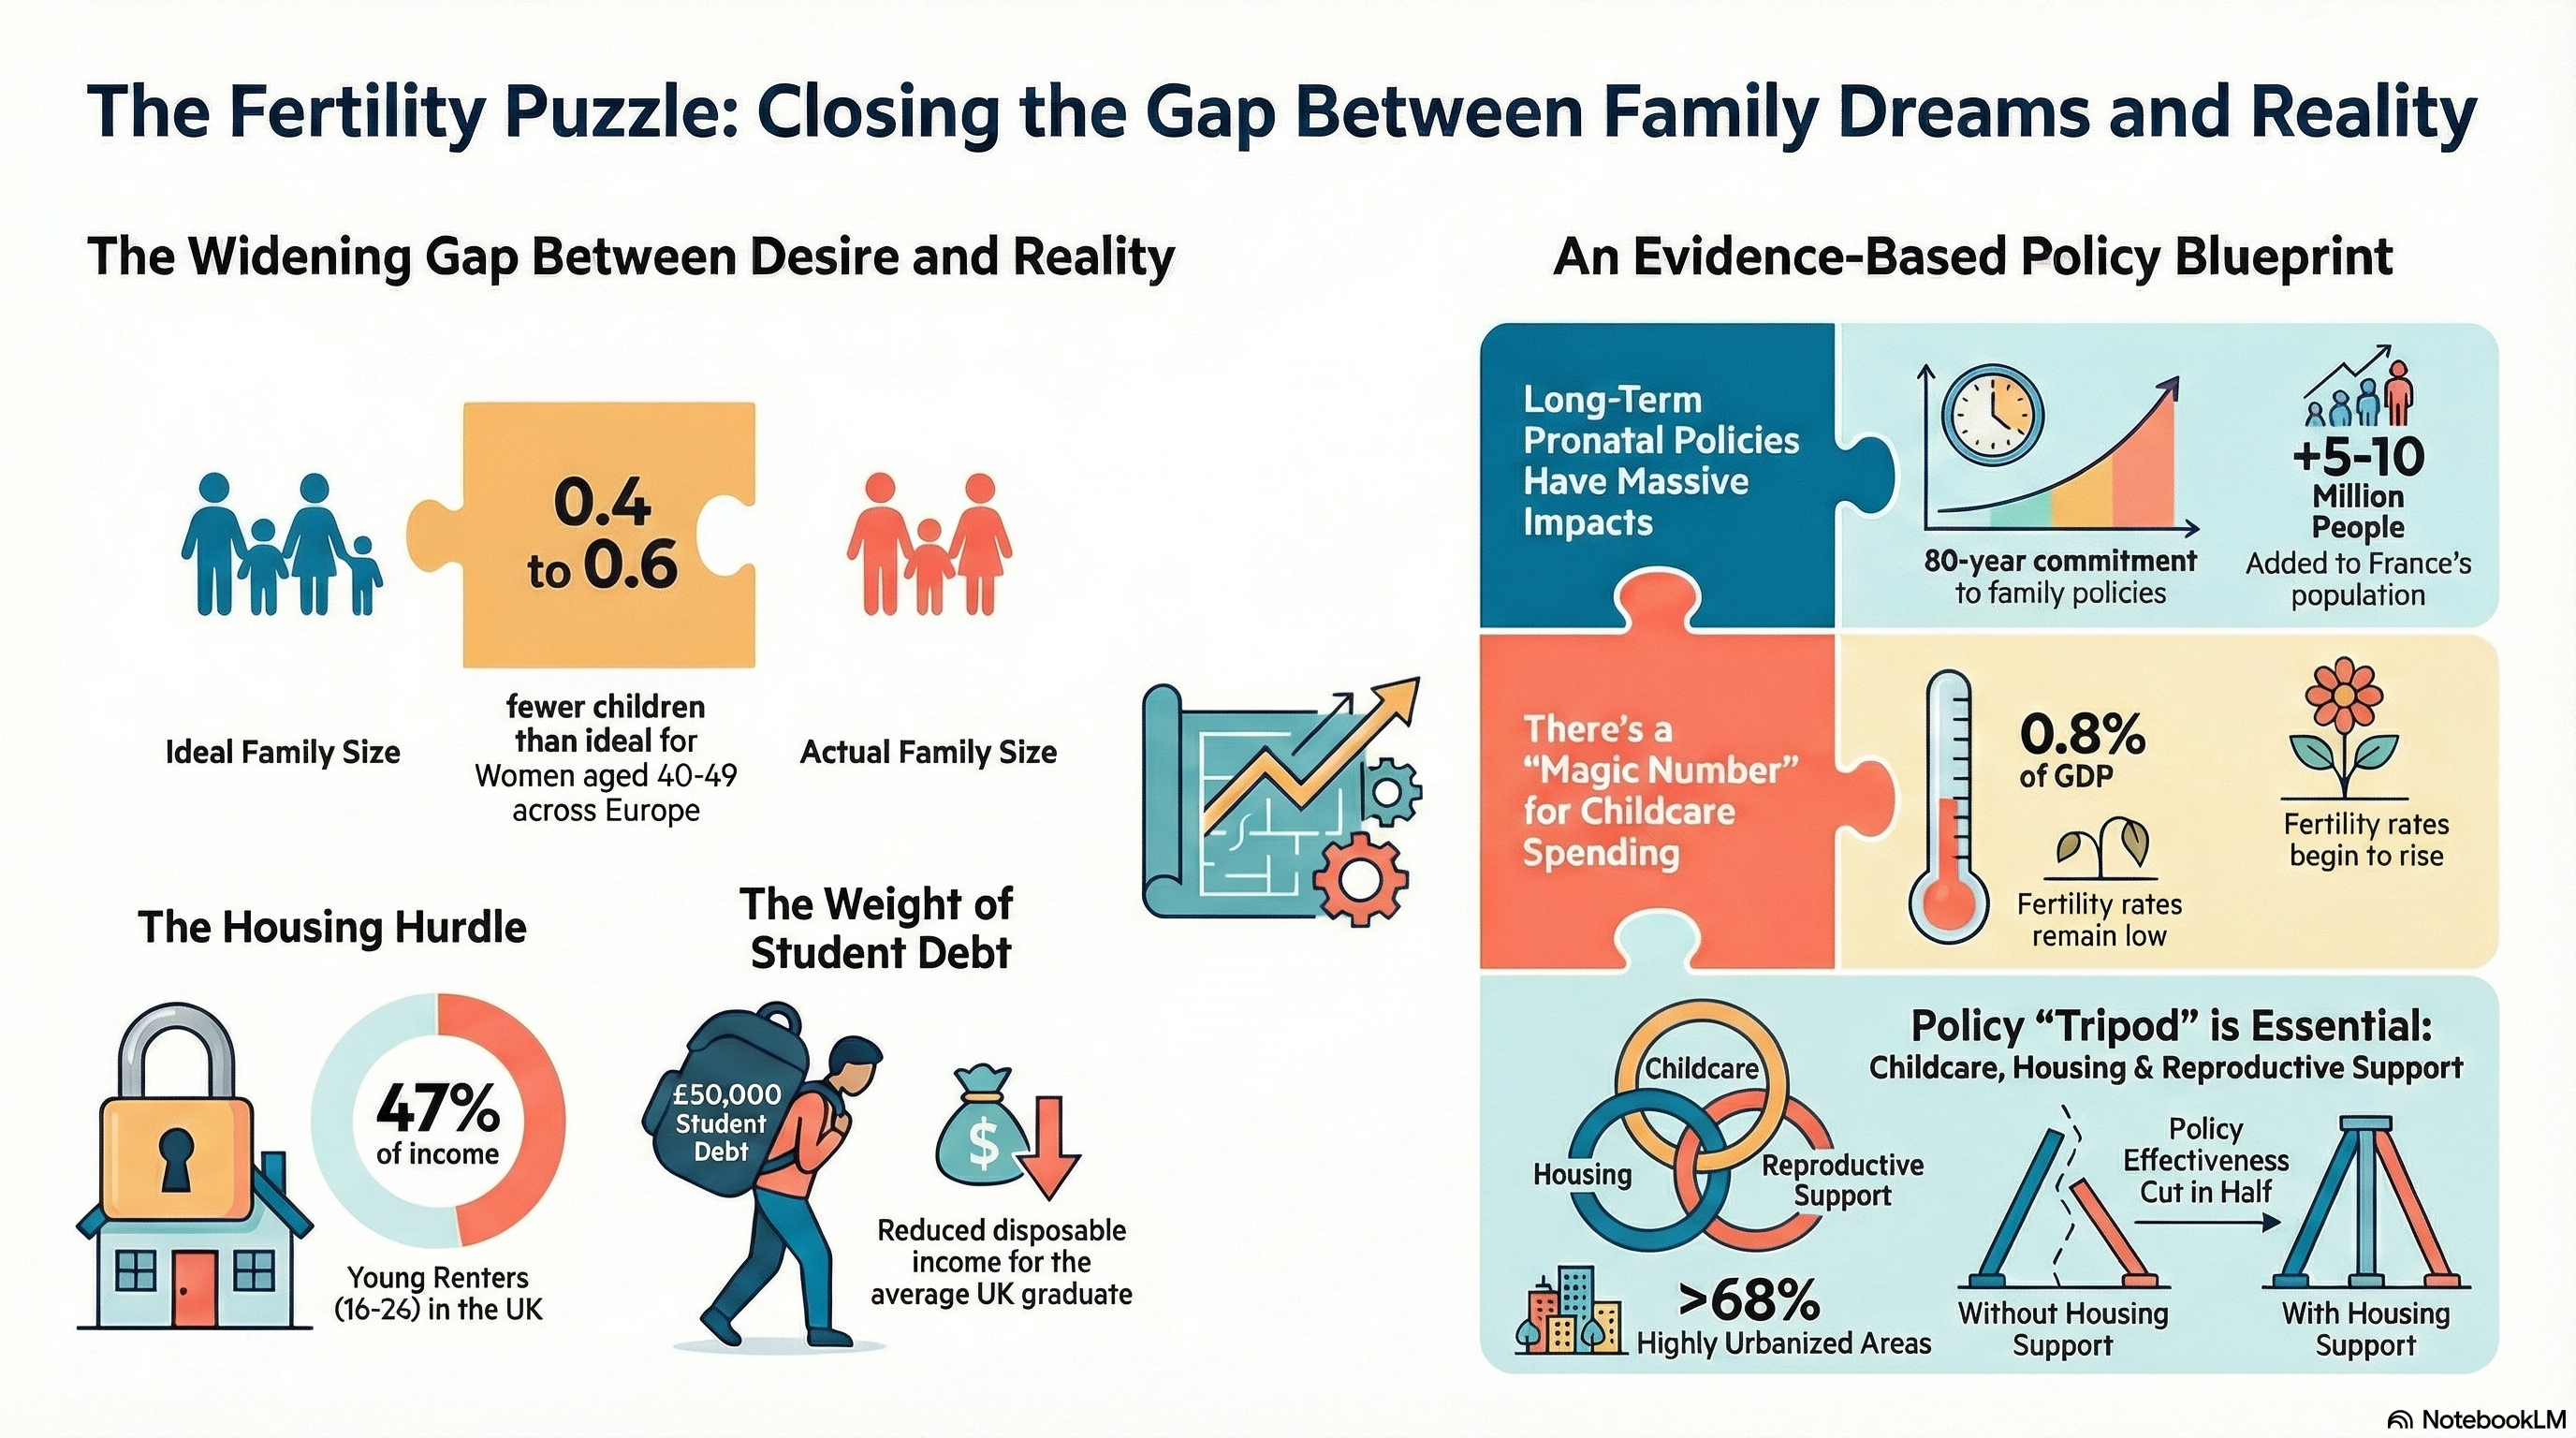
Britain's Baby Bust: The Fertility Crisis - Infographic
Britain's Baby Bust: The Fertility Crisis • Data sources cited in image