← Back to Domains
Fiscal

Public Finances

Debt
95% GDP (£2.9tn)
Interest
£111bn/year
Tax Burden
38.3% GDP (record)
40%Current
Potential: 65%

✗Key Problems

  • 1.Debt interest £111bn/yr - nearly tripled, 4th largest spend
  • 2.Tax thresholds frozen since 2021 - 4m dragged into higher brackets, £45k treated as "high earner"
  • 3.Tax burden 38.3% GDP - highest since WWII
  • 4.Triple lock £15.5bn/yr - 3x estimate, untouchable

✓Solutions

  • 1.EARNINGS-LINK ONLY: Replace triple lock, save £15.5bn/yr (pre-2011 norm)
  • 2.EFFICIENCY TARGET: Return to 2019 staffing ratios, save £25bn/yr (Canada 1990s model)
  • 3.FISCAL ANCHOR: Benefits growth capped at inflation until debt/GDP below 80%
  • 4.EMPLOYER NI CUT: Reduce jobs tax to boost employment (Ireland model)

Analysis

Root Causes

1

Debt interest £111bn/yr - nearly tripled, 4th largest spend

2

Tax thresholds frozen since 2021 - 4m dragged into higher brackets, £45k treated as "high earner"

3

Tax burden 38.3% GDP - highest since WWII

4

Triple lock £15.5bn/yr - 3x estimate, untouchable

Reform Pathway

1

EARNINGS-LINK ONLY: Replace triple lock, save £15.5bn/yr (pre-2011 norm)

2

EFFICIENCY TARGET: Return to 2019 staffing ratios, save £25bn/yr (Canada 1990s model)

3

FISCAL ANCHOR: Benefits growth capped at inflation until debt/GDP below 80%

4

EMPLOYER NI CUT: Reduce jobs tax to boost employment (Ireland model)

Cascade Effects

Reforms in Public Finances will have downstream effects on 5 connected domains:

Policy Costings

Rigorous fiscal analysis of Public Finances reforms

View All Costings →
CONTESTED ESTIMATE
Significant methodological disputes. View caveats below.
Fiscal

Laffer Curve Tax Cuts

Upfront
£0m
Annual
-£45.0bn
Revenue
+£7.5bn
Net Annual Effect
-£37.5bn/year
GDP +2%Productivity +0.4%very high uncertainty
UNCERTAINTY RANGE (Annual Net Effect)
Most Pessimistic
-£60.0bn
⟷
Most Optimistic
-£20.0bn
MAJOR CAVEATS
  • •Static vs dynamic scoring contested: OBR uses static, but 2024-25 receipts below forecast after tax rises
  • •Laffer curve position uncertain: record millionaire exodus (UK now global leader) and non-dom flight suggest behavioural response stronger than models predict
  • •Elasticity assumptions vary widely: academic models (0.1-0.3) vs observed capital flight response
  • •International evidence mixed: Ireland corporate tax success, UK 50p rate underperformed, Kansas cuts failed (context-dependent)
  • •Transition costs real: static cost £40-50bn/yr requires offsetting measures or borrowing
  • •Counter-evidence: UK highest tax burden since 1948 correlates with stagnant growth, not revenue maximisation
4 sources
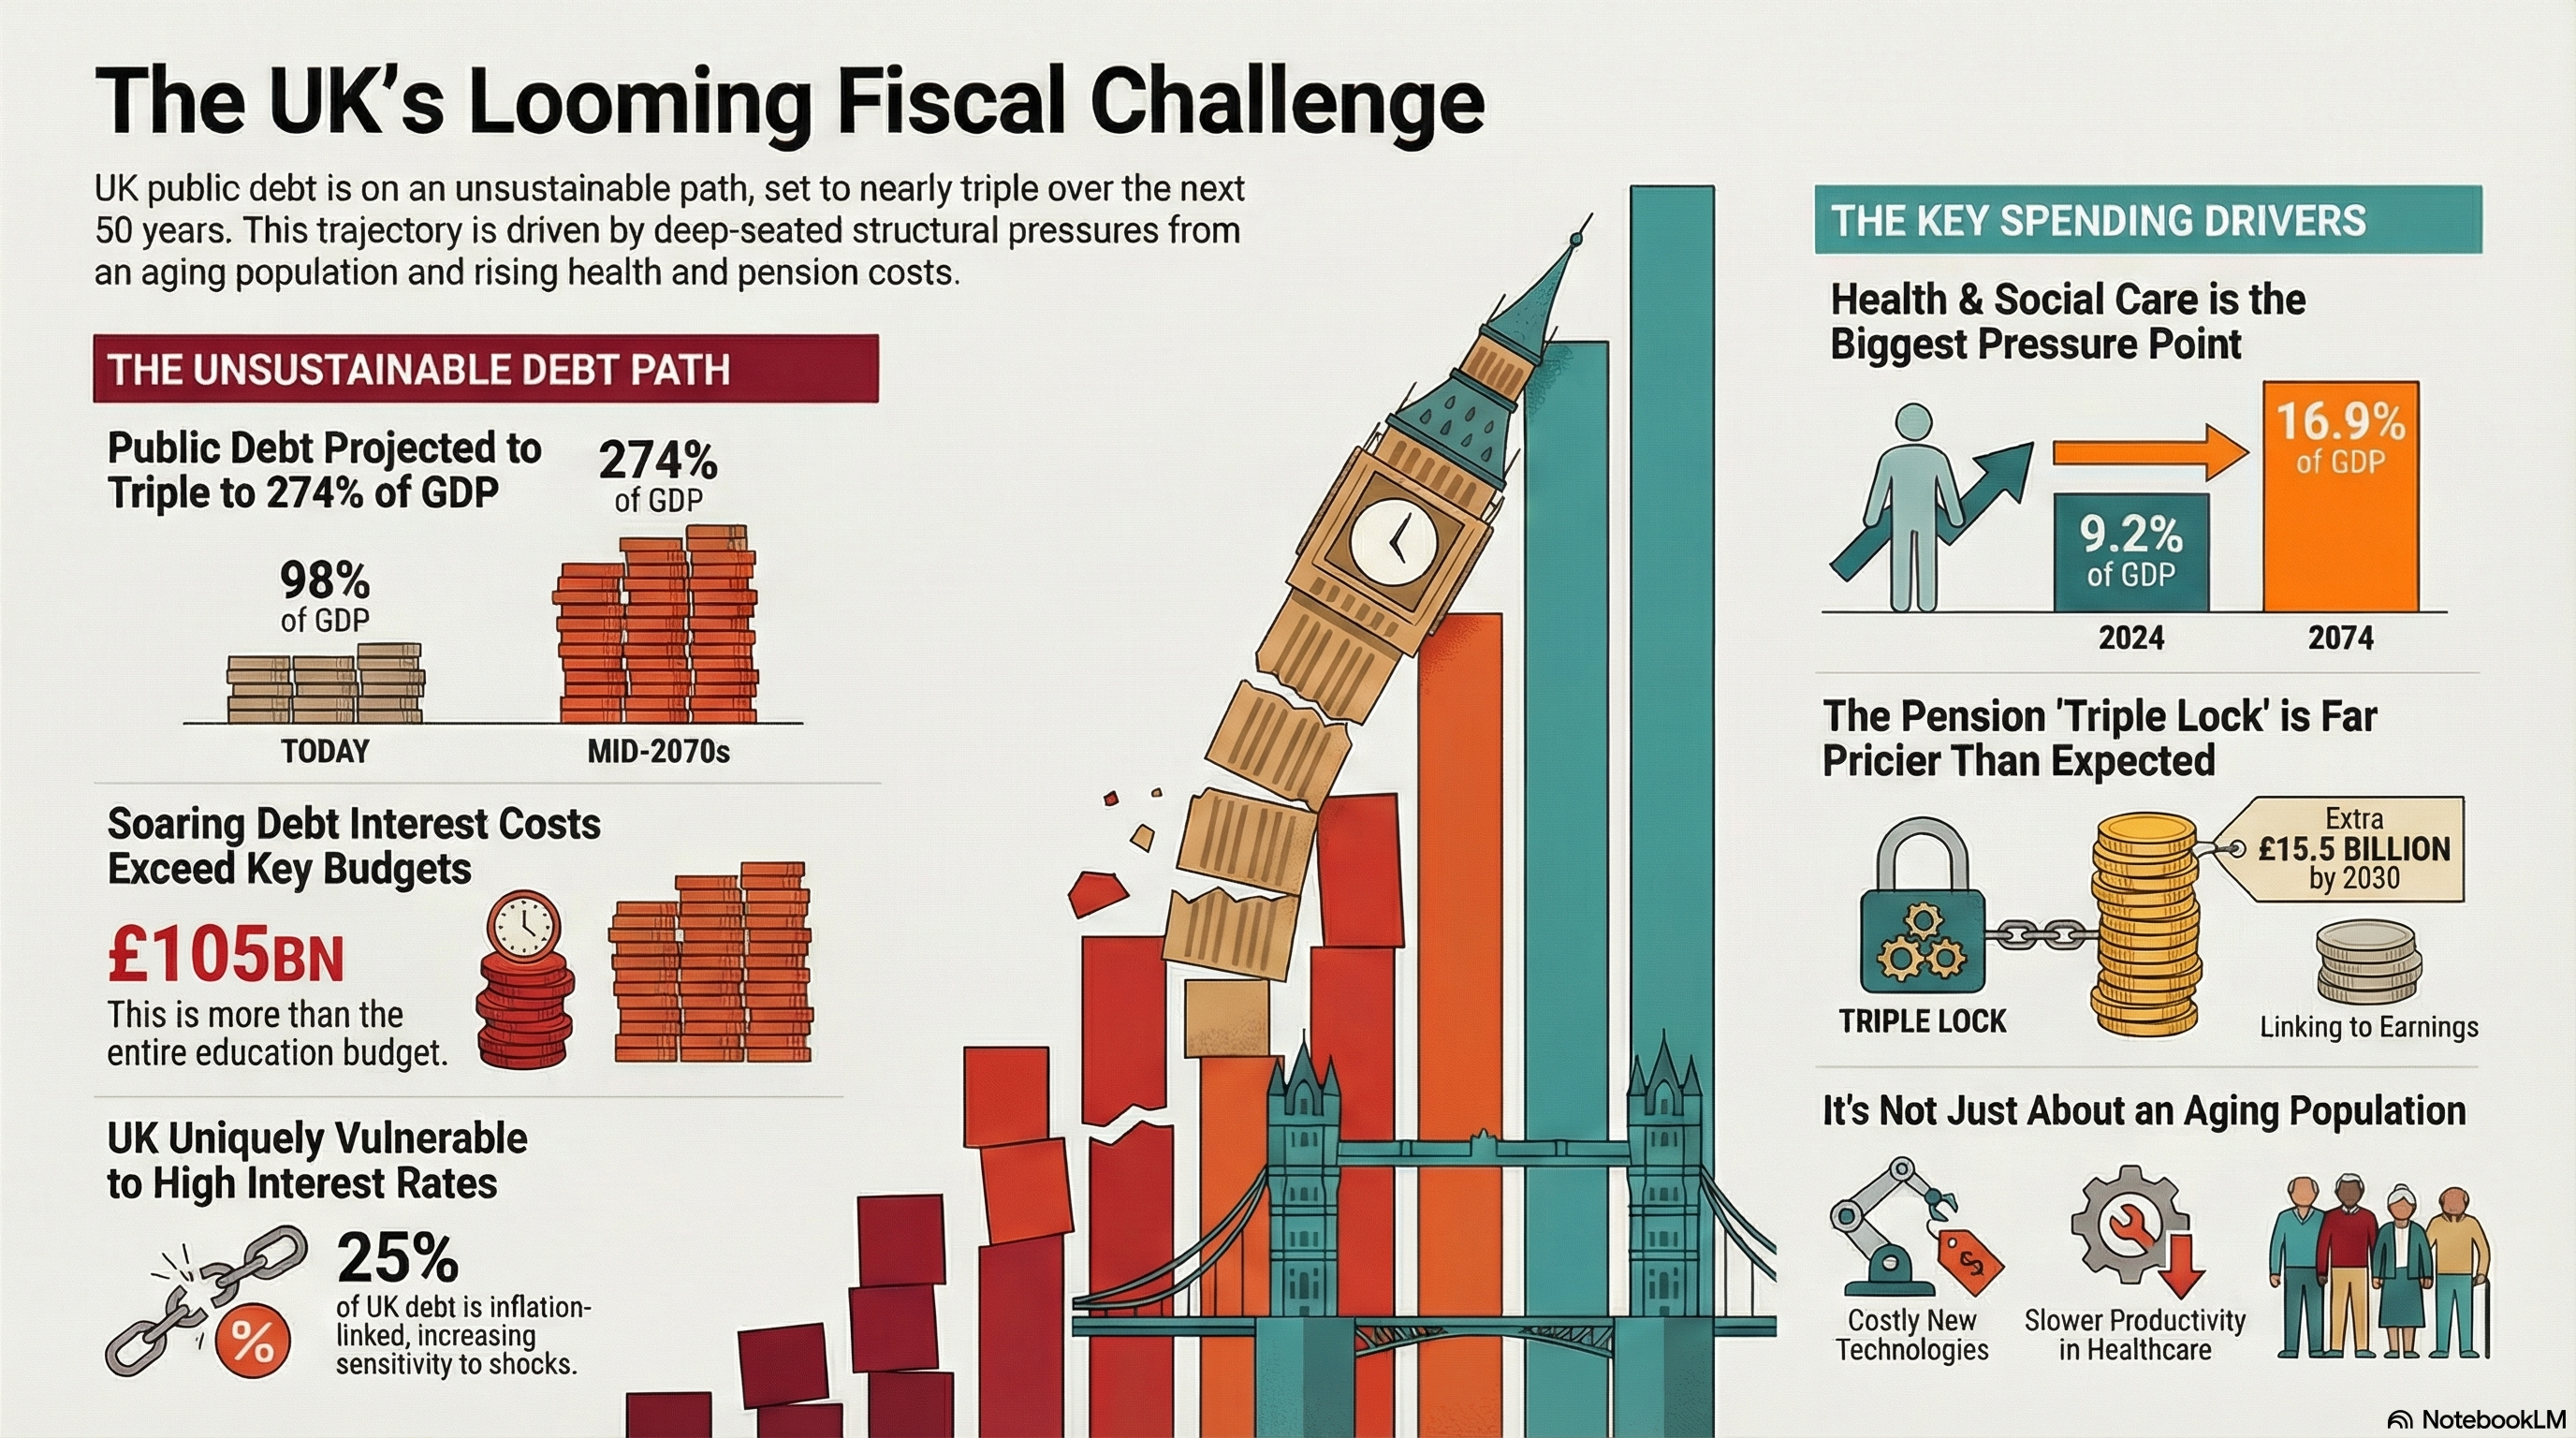
Britain's Fiscal Tightrope - Infographic
Britain's Fiscal Tightrope • Data sources cited in image